July 31, 2026
Why operational simulation belongs in the design office

Every ship is designed to a specification. But specifications describe calm water, a single design speed, and a single draft. Ships operate in the real world: in weather, on specific trade routes, at variable speeds and load conditions, under regulations that were not written with yesterday’s fleet in mind.
The gap between those two realities has always existed. What has changed is that we now have the tools to close it at the design stage, before a single plate is cut.
The problem with designing to a single point
The traditional approach to ship performance assessment relies on a handful of metrics: EEDI, contractual powering curves at design speed, and a sea margin of typically 15 to 25% added to calm-water power to account for everything else. Waves, wind, fouling, weather routing decisions, seasonal variation: all of it absorbed into one number, rarely traceable to the vessel’s actual trade.
This approach has worked well enough for conventional tonnage on well-understood routes. It is no longer sufficient.
EU ETS, FuelEU Maritime, and the IMO’s evolving GHG strategy are making operational fuel and emissions costs significantly more consequential than design-stage indices alone. A vessel that satisfies EEDI can still project a CII rating of D or E on its intended trade. That is a commercial and regulatory liability the owner will carry for decades.
The question ship designers now need to answer is no longer just “does this design meet the specification?” It is “how will this vessel perform in the conditions it will actually experience, on the routes it will actually sail?”
What operational simulation makes possible
Modern simulation tools allow designers to couple the design model directly to real operating conditions: hindcast weather data, AIS-derived route patterns, actual loading and speed profiles. The performance model is exercised against those conditions before the design is committed.
This is not a research exercise. It is a workflow now supported in NAPA applications, and it changes the naval architect’s daily work in concrete ways.
Hull form optimisation is grounded in real operating conditions. Instead of minimising calm-water resistance at a single design point, the designer can evaluate hull form alternatives against the power and speed distribution the vessel will actually experience on its intended trade. A small penalty at the design point may be acceptable if it delivers a measurable gain across the operating range that dominates the route.
Sea margins become distributions. Instead of applying a single margin to calm-water power, the designer works with a power and speed distribution derived from the actual route. The 95th-percentile required power becomes the engineering basis for MCR selection. The conversation with the propulsion supplier shifts from a single design point to a curve and a percentile choice.
Tank sizing is grounded in real consumption. Fuel tank volume is dimensioned against the simulated consumption distribution between planned bunker calls on the intended trade, not against a nominal endurance multiplied by a sea-margin-loaded specific fuel consumption.
ESDs are evaluated on evidence, not catalogue figures. A wind-assist device or air lubrication system is run through the same physics model and the same environment as the bare hull, on the actual route. The output is a realised annual saving in fuel mass, cost, and regulatory compliance burden, with the distribution behind it.
Regulatory exposure is predicted, not discovered. The same model that supports EEDI calculation produces the attained CII trajectory, FuelEU compliance balance, and EU ETS cost projection for the design under realistic operations. Designers can identify regulatory risk at the concept stage, when the cost of response is still low.
A concrete example: Capesize bulk carrier, Port Hedland to Pohang
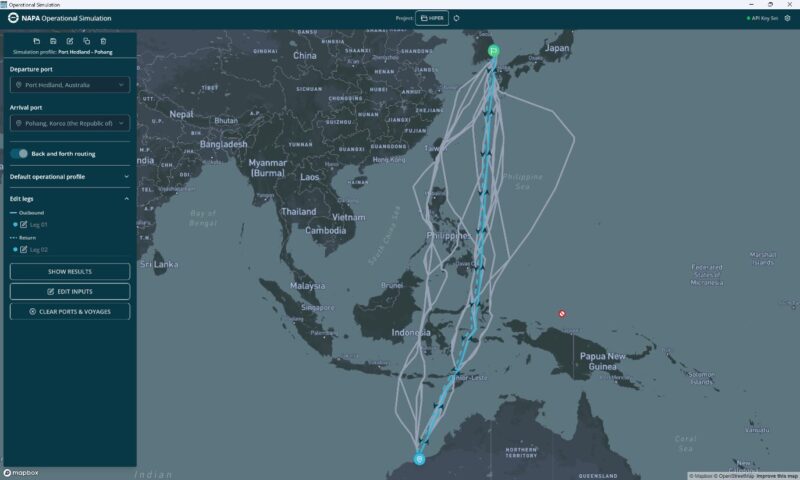
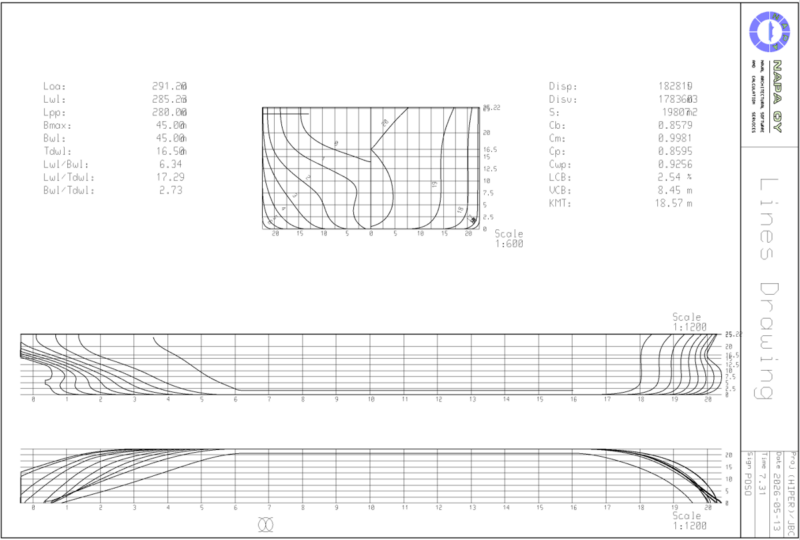
To illustrate what this looks like in practice, consider a Capesize bulk carrier simulated on the iron-ore trade between Port Hedland in Australia and Pohang in South Korea, one of the highest-volume dry-bulk routes in world trade. The hull form used is the Japan Bulk Carrier (JBC) benchmark, a well-characterised reference design used extensively in international validation studies.
14 voyage simulations were run across six round trips, sampling both the shortest-distance route and weather-optimised alternatives across different departure dates and seasons. The engine was held at the design operating point throughout, so environmental variability appeared directly as variability in achieved speed and fuel consumption.
The results surface findings that a conventional design review would not.
Fuel consumption on the laden outbound leg varied between 939 and 1,008 tonnes across the six simulations. That is a 7% spread driven entirely by weather, current, and routing variation across departure dates. For a design typically described by a single fuel-consumption figure, this 70-tonne envelope per voyage is a tangible measure of the operational uncertainty that simulation makes visible and manageable.
Weather-optimised routing delivered an 8.1% reduction in average propulsion power and a 4.3% reduction in total fuel consumption compared to the shortest-distance route, with a 4.2% cost saving.
Wave climate on the route is materially milder than sea margin conventions assume: 70% of voyage time is spent in combined wave heights below 1.0 metres, and 94% below 2.0 metres. This has direct consequences for ESD selection. An air lubrication system would find favourable conditions for most of the voyage, while a wind-assist device needs to be evaluated against this specific wind climate, not a global average.
Most significantly, the simulation exposed the regulatory position of the design. The attained CII for the JBC on this trade is approximately 5.3 g CO₂ per DWT-nm, against an IMO 2030 requirement of 2.27 g/DWT-nm, placing the design well into the E band. The attained EEDI exceeds the Phase 3 requirement by 16%. Without intervention, whether power-train adjustment, wind-assist, air lubrication, or low-carbon fuel, this is a vessel with a compliance problem that the calm-water specification did not reveal.
Identifying this in the design office, rather than on the second annual reporting cycle after delivery, is exactly the value that operational simulation delivers.
How the design workflow changes
The shift from specification-driven to data-validated design does not require new tools built from scratch. For the large majority of commercial newbuilds, a NAPA design model already exists and the operational simulation reuses it rather than rebuilding it.
What changes is the sequence of decisions and the artefacts that support them. The justification for a chosen MCR, tank volume, or ESD selection is now supported by a simulation output that the owner and class can interrogate: the configuration, the input data sources, the output distributions. This is closer to how engineering already works in aerospace and energy, and it transfers naturally to the post-delivery context where the same model and infrastructure are reused for in-service performance benchmarking and retrofit assessment.
Critically, the naval architect’s judgement becomes more important, not less. Deciding which design variations are worth simulating, which inputs need sensitivity testing, and when a simulation output is too precise to be honest about its input uncertainty are questions of engineering experience that no tool resolves automatically.
The direction of travel
The first shipbuilding contracts that include guaranteed operational performance clauses rather than only calm-water reference conditions are already in the market. This signals a transition that will accelerate: owners increasingly want performance commitments grounded in evidence, and yards that can provide them will be better positioned in competitive tendering.
Operational simulation is the infrastructure that makes those commitments defensible. It is shifting from a useful capability to a business-critical one, and the design office is where it belongs.
This post is based on a paper submitted to the High Performance Marine Vehicles (HIPER) Conference 2026 by Ludmila Seppälä and Antti Pösö of NAPA. The full paper presents the complete simulation methodology and case study data.
NAPA Operational Simulation is available as an integrated module with NAPA Engineer. Book a demo session to see it applied to your vessel type and trade route.