
November 3, 2026
More data is not always same as better data: What to look for in a ship performance monitoring platform

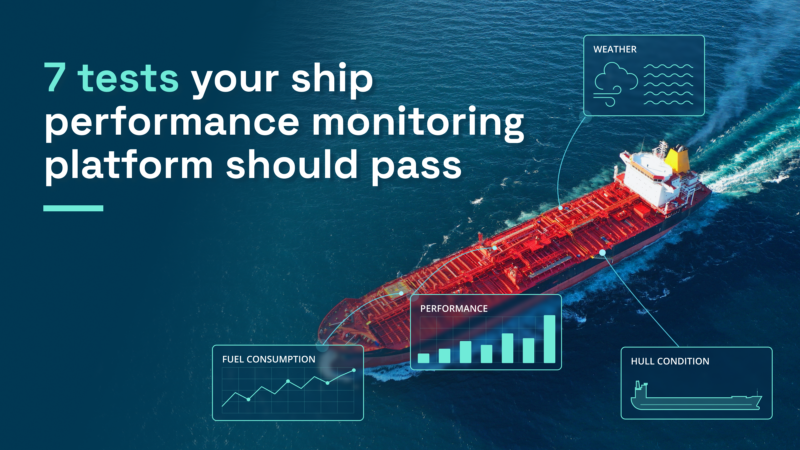
Shipping is producing more vessel data than ever. The industry is now asking how much of it turns into decisions, and how much of it can be trusted.
Ask industry executives how much vessel data turns into decisions and the answers range from low single digits to over 60%. That was the question behind Splash247’s SplashTech report in September, and its standfirst gave the verdict: “The next digital race is not about collecting more data.”
The numbers explain why. A modern ship can produce more than a thousand of high-frequency data parameters out of which approximately 50 is the critical core for vessel performance monitoring. In many cases for ship performance analytics, the challenge isn’t the data quantity but if the data and results can be trusted.
Performance results carry money. When fixing a time charter, the owner sets the speed and consumption points the vessel is warranted to meet. If they are too optimistic, the ship faces underperformance claims. If they are too cautious, the vessel looks less competitive and earns less. Setting them well depends on knowing how the vessel actually performs across speeds, drafts and weather. On top of that, every extra tonne of fuel now adds cost under EU ETS, grows any FuelEU Maritime deficit and worsens the CII rating. So the question for any platform is whether its results are reliable enough to put into a contract.
The evidence points the same way. A reflection on HullPIC 2026 notes that isolating the effect of fouling takes normalization and modeling, and that AI-based tools are only as good as their input.
Signal data vs. noon reports
I do not think signal data is better by default. In Debunking 7 maritime digitalization myths, I wrote that signal data is richer in insight but is no guarantee of better decisions, that noon reporting can also deliver gains when its scope is well defined, and that both need close monitoring of data quality. In How signal data is changing vessel performance for dry bulk shipping, I explained why physics-based models are needed to separate the effects of weather and currents from true vessel performance.
Signal data, meaning high-frequency readings taken directly from the ship’s own sensors and onboard systems, gives you far more detail than a noon report. But more detail only helps if the data is trusted and the analytics behind it can explain what changed.
What good ship performance analytics looks like
Trusted ship performance analytics pass seven tests. The tests apply to any solution, ours included, so use them as questions when you compare options, and see how NAPA Fleet Intelligence answers each one.
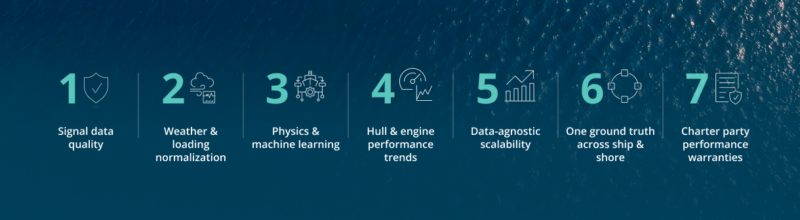
1. Signal data quality: trust it before you analyze it
Good analytics starts with automated data quality: sensor validation, outlier filtering, drift detection, and clear visibility of gaps. Without this, high frequency data only produces noise faster. Good tools show you how reliable each result is, rather than hiding it.
More data is not better data. Trusted data is.
2. Apples-to-apples comparisons, normalized for weather and loading
Raw consumption figures mean little until they are normalized for weather, sea state, and draft. Good looks like being able to compare a vessel against itself, its sisters and its baseline under equal conditions. On a daily average, fouling, weather and speed changes all look the same.
Was it the hull, or was it the weather?
3. A performance model that knows the ship: physics plus machine learning
Good models combine naval architecture physics with machine learning trained on the vessel’s own operational data. That gives a sensible baseline from day one, improves as data accumulates, and stays explainable. A pure black box, or a static sea trial curve, is not enough.
Physics gives you the starting point. Data tells you the truth.
4. Hull and engine performance trends: seeing change as soon as it starts
Vessel performance changes gradually, through hull fouling, propeller condition and engine wear. Good analytics follows this as a continuous trend and shows a deviation as soon as the data supports it, not in a periodic report weeks later. Alerts should flag meaningful change only, so they don’t cause alarm fatigue.
Noon data tells you something happened. Signal data tells you what happened.

See how NAPA Fleet Intelligence works in practice
5. Data-agnostic and scalable performance monitoring
Good analytics works with whatever data sources a fleet already has, whether that’s onboard automation systems, flow meters, torque meters or third party data loggers. It should accept different sampling rates and formats without forcing a fixed hardware setup. Customers should also keep clear ownership of their data and be able to connect it to their own tools. That lets the solution scale across a mixed fleet without a separate integration project for each vessel.
Start with the data you already have.
6. One ground truth across ship and shore
The crew and every shore team (technical, operational and commercial) should work from the same performance data, calculated the same way. When the superintendent, the operator and the chartering manager all start from one shared truth, time goes into decisions instead of arguing about whose numbers are right.
When every team looks at the same signal, the conversation changes.
7. Charter party performance warranties: confidence in the vessel’s true performance
The first six tests lead to this one, which is where the direct monetary value shows up.
Continuous, normalized results give you a performance picture of the vessel that you can verify and defend. With that confidence, owners can set charter party performance warranties close to the vessel’s real capability instead of adding wide safety margins. A vessel warranted at its true speed and consumption fixes more competitively and earns better hire, and the same record supports discussions if a performance claim comes up later.
Uncertainty costs you hire on every fixture.
See NAPA Fleet Intelligence on your own fleet’s data
Hold any platform to these seven tests, ours included. To see how NAPA Fleet Intelligence works in practice.